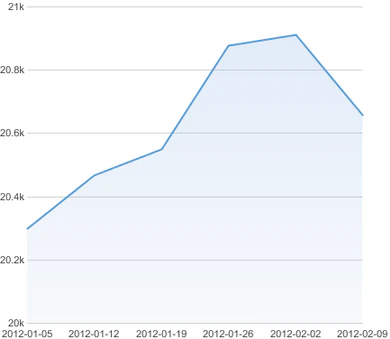
When you create a card, Domo sets the minimum value scale value to 0 and automatically determines a plausible maximum value based on the highest value in your DataSet. For most charts this is optimal. However, in some instances you may want to change either the minimum or maximum value to present the data more understandably. For example, in the following chart, all of the values are in the range of 20,000 to 21,000. Because the minimum value is automatically set to 0, it is difficult to see changes in the data.Documentation Index
Fetch the complete documentation index at: https://domoinc-openapi-sync-documents.mintlify.app/llms.txt
Use this file to discover all available pages before exploring further.

- Open the Analyzer for the chart you want to edit.
- In Chart Properties, click Value Scale.
- Enter the desired minimum and/or maximum values in the Min and Max fields, respectively.