Documentation Index
Fetch the complete documentation index at: https://domoinc-openapi-sync-documents.mintlify.app/llms.txt
Use this file to discover all available pages before exploring further.
Intro
This article describes how to use the AI Services tiles in Magic ETL. To learn how to use tiles in DataFlows, see Create a Magic ETL DataFlow.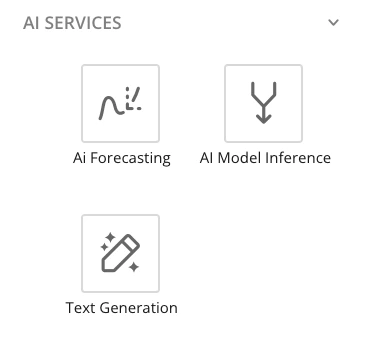
AI Forecasting Tile


Configure the AI Forecasting Tile
After you connect your input DataSet to an AI Forecasting tile on the Magic ETL canvas, you can configure your model preferences. Select the AI Forecasting tile to expand the tile editor. Complete the steps in the editor.

Note: The number of rows in your output DataSet depends on the number of data points you configured to be forecasted.
Interpret Results from the AI Forecasting Tile
You can interpret and explore the results of your forecast by opening the output DataSet in Analyzer. Use the chart type finder to choose a Forecasting Chart. Use the upper and lower bound columns from your output DataSet to set your bounds and display the forecast confidence ranges. Learn more about the Forecasting Chart.
AI Model Inference Tile

Required Grant
To access the AI Model Inference tile in Magic ETL, the following grant must be enabled for your role:- Use AI Services — Allows a user to access and use the AI Services in Domo.
Configure the AI Model Inference Tile
- Select the DataSet you want to gather inferences from and open it in Magic ETL.
-
In the Magic ETL sidebar, expand Data Science and drag an AI Model Inference tile to the canvas.

- Connect your input DataSet to the tile. You can only use one DataSet as input.
-
In the tile editor, choose Select a Model to search for and choose a model to use for your inference. The model schema must match the schema of the input DataSet. If the schemas do not match, an error message displays.
If the schema of your input DataSet matches the model’s schema, you can select the model you want to bring in. You can only use models with a CSV type in Magic ETL.


- Depending on the model, you can select a task if multiple options are available in the Pick a Task dropdown. The model task automatically generates from your selected model. Models may have multiple tasks, but only one task is selected for the DataFlow. In the example used above, only the “Other” task type is available.
- Select a tier, depending on the number of resources used to run the model. A tier is the size of the resources the model is running with and the number of central processing units (CPUs) used. Learn more about compute tiers.
- (Optional) Check the box labeled Include Input Data in Output Data to duplicate all the rows from your input DataSet. This means that if you have 10 rows of data in your input, there will be 10 rows of data in your output. If you leave the box unchecked, only the inferred data is included in the output DataSet.
Text Generation Tile (Beta)

Required Grants
To access the Text Generation tile in Magic ETL, the following grants must be enabled for your role:(Learn more about grants.)
- Execute AutoML
- Create AI Service Models
- Use AI Services
Configure the Text Generation Tile
Note: The Magic ETL Preview function doesn’t work with the Text Generation tile, due to the timeout of the AI model.
- Open the Magic ETL canvas and choose an input DataSet that contains a text column you want to analyze.
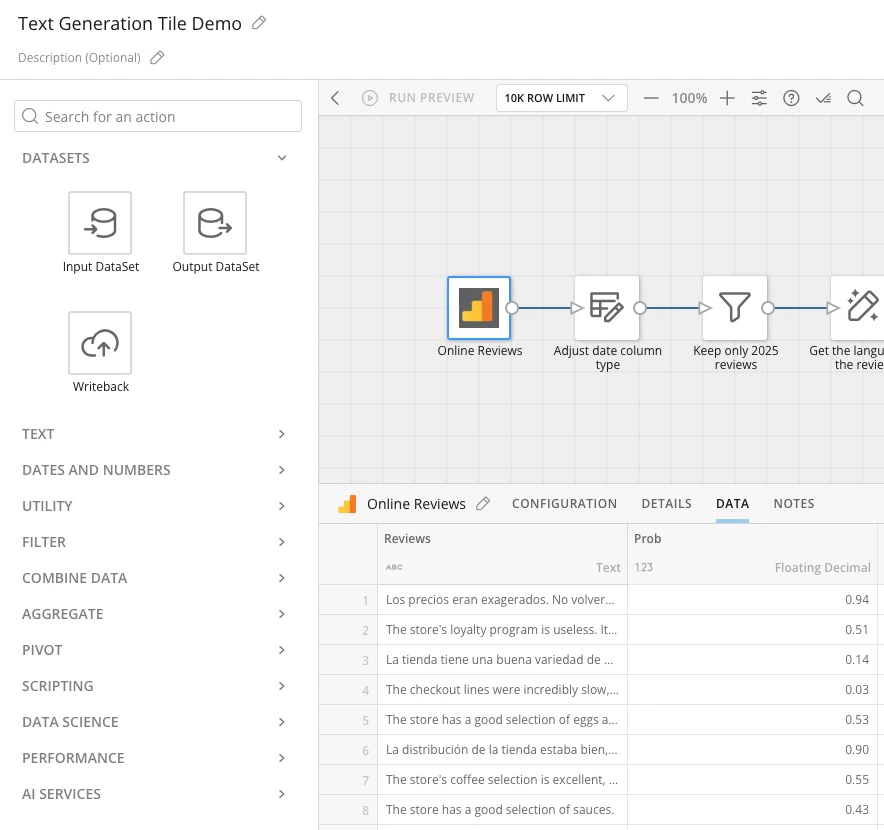
-
Under AI Services in the left drawer, drag a Text Generation tile to the canvas.
The tile editor expands below the canvas.

-
In the tile editor, choose the AI model you want to use with the Text Generation tile.
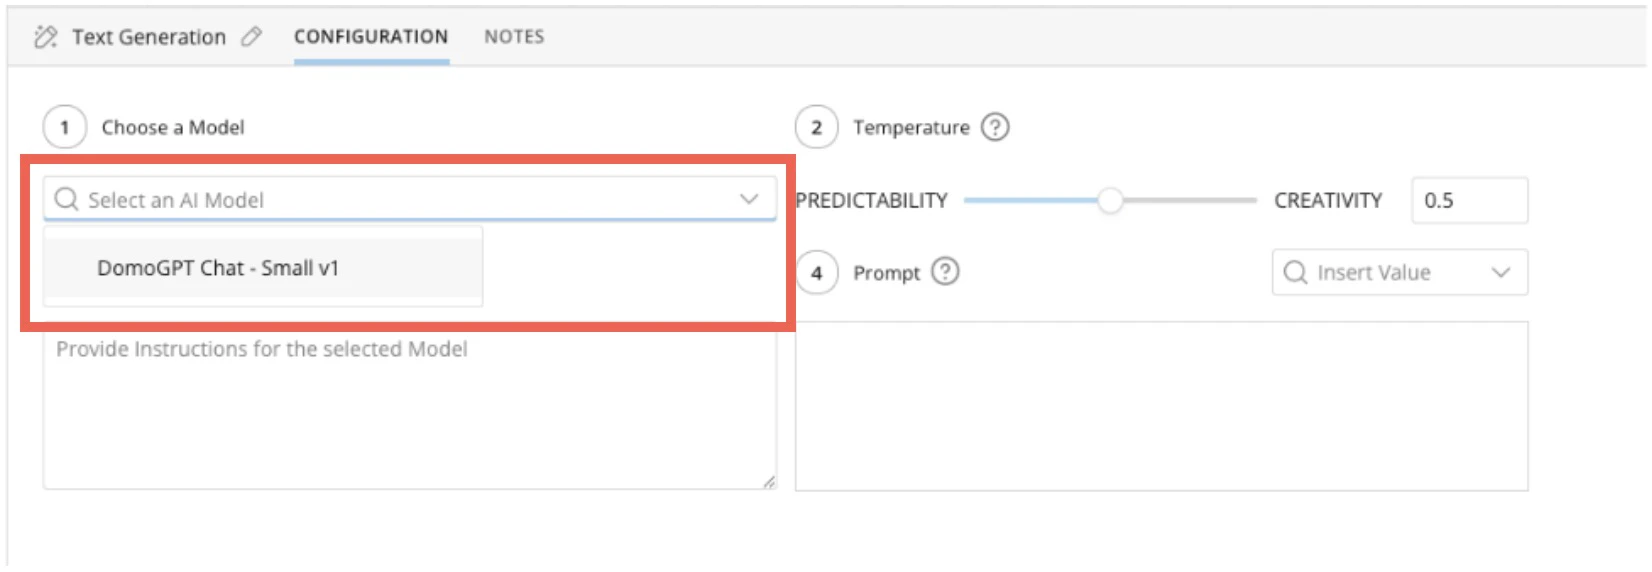
-
Then choose the temperature of your desired response. Lower values provide more predictability, while higher values provide more creativity.
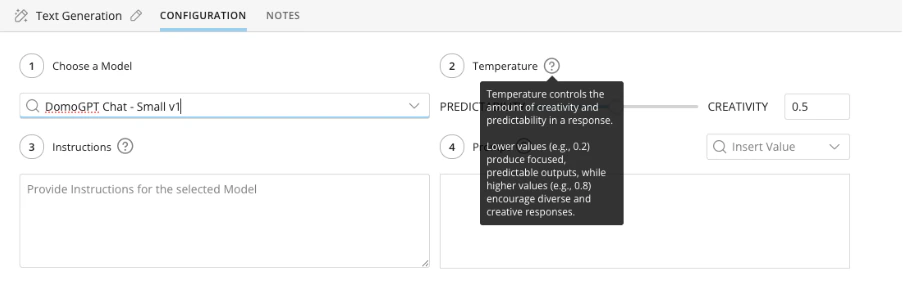
- Provide the model with instructions on how to analyze the column. Be very specific; describe exactly what you want the model to do (and not to do).

-
Use the Insert Value dropdown to choose the column that contains the text to be analyzed. You can also provide more details about what should be done with the data.

Output. You can use tiles farther downstream in the DataFlow to rename that column.
Notes:
- You can include multiple Text Generation tiles in the same DataFlow, tasking them with different aspects of analysis for the column (or analysis of different columns).
- You can give multiple instructions in a single Text Generation tile, although you’ll need a way to parse the results of the multiple instructions from the single output column. For example, you could instruct the model to separate the output of each instruction with a specific delimiter and then use the Split Columns action to parse. Here’s an example of the output DataSet from a DataFlow leveraging multiple instances of the Text Generation tile to analyze language, translate the review to English, analyze sentiment, and categorize the review based on provided themes.